Viewing your report
Viewing your report
To view the result of the query you have built, use the Run option from the main menu.

There are two types of report layout available:
- Grouping Report
This provides more flexibility, and allows you to manipulate the report layout when viewing the report.
- Big Data Report
This has less flexibility but is more suitable for large volumes of data.
These are covered in more detail below
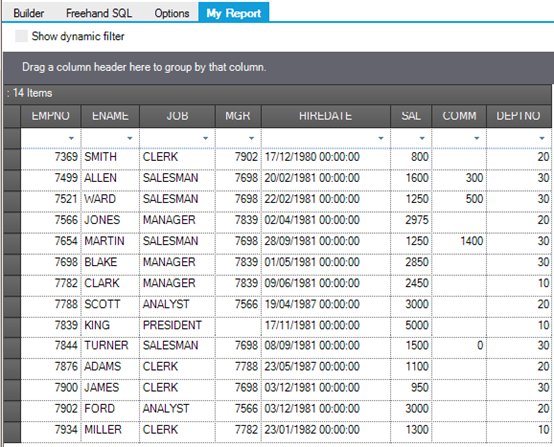
The example below is a Grouping report from a table of employee data:

The report is in the My Report panel. You can switch between this and the Builder tab by clicking on the panel headings.
You can manipulate the report in the following ways:
- Adjust column widths by dragging the boundaries between column headers.
- Change the order of columns by dragging the column header and dropping it between other columns.
- Sort the data by clicking once on the column header. Click again to sort the data in the reverse order.
- Select data using the drop-down boxes just below the column headers. This allows you to select all occurrences of one instance, including the occurrence of empty fields.
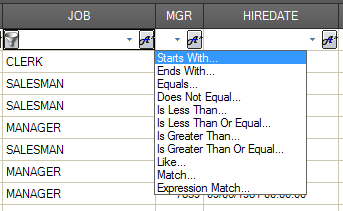
- Check the ‘Show Dynamic Filter’ box to provide further selection features. These appear as additional filter tools in the column headers.

- Drag a column heading into the Grouping box above the column headers. This organises the rows into groups. Click on the [+] symbol by the group to expand it into its constituents.
- You can include more than one group.
The example below shows the employee table grouped by job within Department (DEPTNO). The Salesman job is expanded into its 4 employees.

The example below shows the same data displayed as a Big Data Report.

There are very few formatting options, but the Big Data report will give better performance when used with very large volumes of data.
The formatting options available are:
- Clicking on the column header sorts the report by that column.
- You can adjust column widths by dragging the boundaries between column headers.