Example Application
Example application.
An example reporting GUI application is available for download. It utilises many of the functions of the myObjectiveOLAP API and includes use of the Fast reporting functions. This is available from the myObjectiveOLAP Downloads page.
The VBA application can be used against any native 10g or 11g Oracle OLAP standard Analytic Workspace without any change to the VBA, and can be used against non-standard Analytic Workspaces with little change to the VBA.
Using the example application
In order to use the example application you should connect to your Oracle OLAP environment using the connection method appropriate for your server installation.
You should then ensure you have the necessary Analytic Workspace attached by your database session, this can be accomplished through the Analytic Workspace Selector
The application is designed as an example and can be easily customised for your specific installation requirement.
![]() Hint
Hint
All of the screen-shots shown below use the Oracle provided GLOBAL example Analytic Workspace which can be downloaded from the Oracle website.
Main Window
When you start the example myObjectiveOLAP application the following New Report screen is displayed.

The following Main Tabs allow the user to:
Tab |
Purpose |
New Report |
Define a new report, choose dimensional orientation, set limits, apply formatting, save the report, run the report |
Existing Report |
Apply an existing report, run an existing report, run all existing reports, delete existing reports |
Advanced |
Display the hidden worksheet which holds meta-data in relation to existing reports. |
Table: myObjectiveOLAPHelp-2012-moo Fast Reporting-Example Application:1.0
New Report tab
When you want to create a new report you should select the measure you want to report on from the Measure drop-down list, choosing a measure will populate the Available Dimensions list. You can then drag your dimensions to the Down Dimension and Across Dimension layout area.
Limits tab
After selecting the Measure and orientation of your new report you should move over to the Limits tab. In the limits window you can type free form OLAP limit statements. Once you have entered your limit statement you should press the Apply Limits button. Any errors in your limit statement will be displayed in the window below. Alternatively you could choose a pre-saved text file with valid OLAP limit statements in it. To select a pre-saved file press the Apply a Saved Limit button, this will enable you to browse local file-systems available to you for a valid file. Pressing Open on a selected file will Apply the limits and any errors will be reported to you.

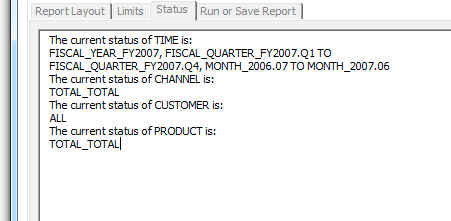
Status tab
After applying your limits you can check the Status of your selected Measure by navigating to the Status tab.
Run or Save Report tab
After you are satisfied with your new report's orientation and applied limits you should select the Run or Save Report tab.
This tab enables you to select the destination Excel worksheet of your report, the starting position of your data, and a number of formatting options. You can then Run your report or choose to Save it.
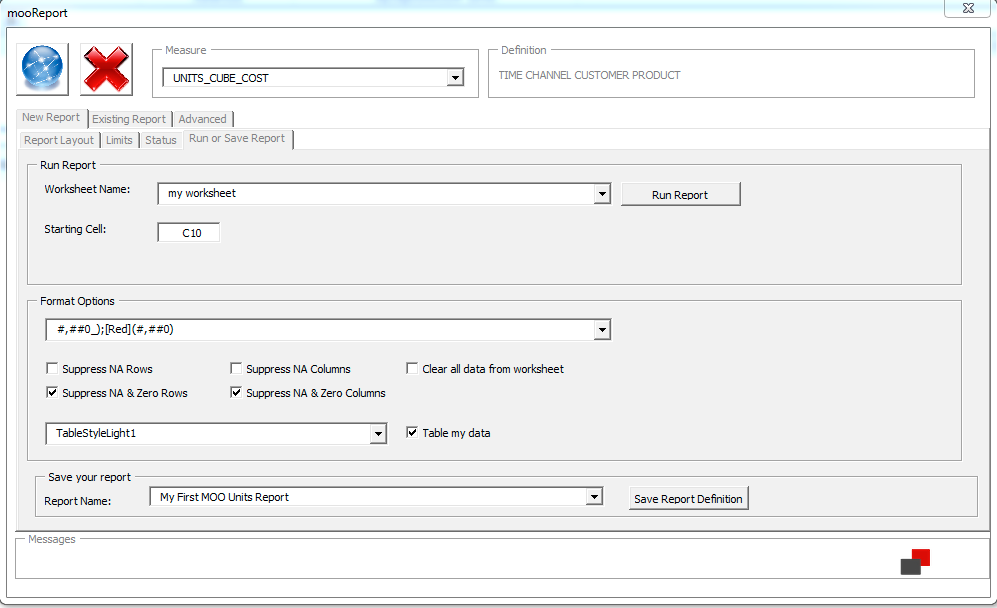
The following table gives you an overview of the fields available in the Run or Save Report tab.
Field / Option |
Purpose |
Worksheet Name |
This determines the destination Microsoft Excel worksheet for your report. This does not have to pre-exist. |
Starting Cell |
This is the cell of the first field of data from your measure. In most cases you will have dimensional descriptions in the X and Y axis on your report, so should choose cell B2 at a minimum. |
Format Options Drop-down |
Enables you to select the numerical cell format applied to your data. This only affects data retrieved from your measure and does not apply to your dimensional descriptions. |
Suppress NA Rows |
Adds an additional limit statement to keep only non-NA rows before running your report. |
Suppress NA and Zero Rows |
Adds an additional limit statement to keep only non-NA and non-zero rows before running your report |
Suppress NA Columns |
Adds an additional limit statement to keep only non-NA columns before running your report. |
Suppress NA and Zero Columns |
Adds an additional limit statement to keep only non-NA and non-zero columns before running your report |
Clear all data from worksheet |
This wipes the destination worksheet before publishing your report into it. This is useful if you have the row and column suppression switched on, as the scale of your report could significantly grow and shrink. |
Table my Data Drown Down and Tick |
This is only seen if the VBA behind the example application identifies that the Excel version is greater than or equal to Microsoft Excel 2010. If the "Table my data" box is selected then the selected Table Style from the drop down box will be applied to your published report. |
Report Name |
This is the name that refers to this specific orientation, limit, and formatting definition. Multiple reports could exist on a single |
Table: myObjectiveOLAPHelp-2012-moo Fast Reporting-Example Application:2.0
Existing Report tab
You can select and run pre-saved reports from the Existing Report tab. Select the report you want to run or review and then select your desired option.
Option |
Action |
Apply |
Apply settings of selected report and navigate me to the Run or Save Report tab |
Apply & Run |
Apply settings of selected report and run selected report. |
Run All Reports |
Run all reports available in this workbook. |
Delete Report |
Delete the selected report. |
Table: myObjectiveOLAPHelp-2012-moo Fast Reporting-Example Application:3.0

Advanced tab
The advanced tab enables you to unhide the hidden Excel worksheet which stores the meta-data definitions of your saved reports.
The example report uses a mixture of cell-contents and comment fields to store information relating to your saved report. The meta-data definitions are documented in the below table (myObjectiveOLAPHelp-2012-moo Fast Reporting-Example Application:4.0) and stored in a worksheet called mooFRStore. Each column holds the definition of one saved report.
Field |
Data Type |
Purpose |
Row 1 |
STRING |
Report name |
Row 2 |
BOOLEAN |
External Saved file. This will be TRUE if your limit statement is saved in an external text file, otherwise it will be FALSE |
Row 3 |
STRING |
If your limit file is saved in an external text file this field will hold the directory location and filename. |
Row 4 |
STRING |
If your limit does not use an external file, but limit statements entered into the Limits tab your limit statements will be saved here. |
Row 5 |
STRING |
Worksheet name. The name of the worksheet which acts as a container for your report. |
Row 6 |
STRING |
Start Cell. The cell the data element of your report should start in. |
Row 7 |
STRING |
Down Dimension. The dimension whose orientation you have selected for the X axis of your report. |
Row 8 |
STRING |
Across Dimension. The dimension whose orientation you have selected for the Y axis of your report. |
Row 9 |
STRING |
Measure. The measure selected. |
Row 10 |
BOOLEAN |
Suppress NA rows. |
Row 11 |
BOOLEAN |
Suppress NA and Zero rows |
Row 12 |
STRING |
The selected cell formatting for the data element of your saved report. |
Row 13 |
BOOLEAN |
Suppress NA columns. |
Row 14 |
BOOLEAN |
Suppress NA and Zero columns |
Row 15 |
BOOLEAN |
Clear Worksheet before publishing new report |
Row 16 |
BOOLEAN |
Table my data, If you are using Excel 2010 or greater and this is set to TRUE then the example application will apply the Table Style as specified in Row 17. |
Row 17 |
STRING |
Table Style. If you are using Excel 2010 or greater and you have selected Table My Data then the Table Style will be saved in this field. |
myObjectiveOLAPHelp-2012-moo Fast Reporting-Example Application:4.0